You may need to create a report if one doesn't already exist in one of the reporting areas.
The Reports area lets you to quickly create a new report, or edit, preview, print or export your saved reports.
For example, you can create a report to:
-
identify clients that are flagged under the Client > Extra tab, who you want to invite to a seminar.
-
show clients within a specific age range.
-
show client or partner wip and debtor to provide information not in MYOB standard reports.
Any of these reports examples could be used generate a Creating a mail merge for emails to some or all of these clients if required.
There are various reporting areas where you can create your report depending on the data you need.
For information on the fields available in the various Practice Manager reporting areas, see Practice Manager Reports and what they contain.
To create a report
-
In the toolbar, click the Reports

-
Select the report area and sub-area for your new report.
-
Click New at the bottom of the Reports page. The New Report page opens.
-
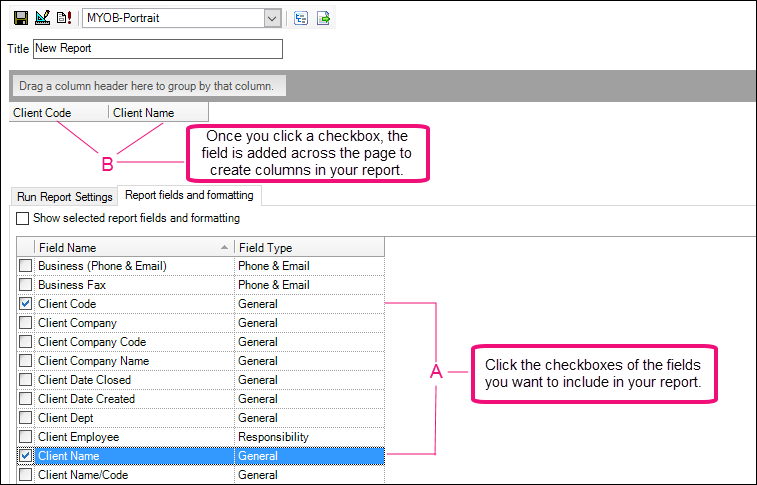
Select a template from the template drop-down. The default options are MYOB-Portrait and MYOB-Landscape.
-
Enter a name for your report in the Title field.
-
Click the checkboxes for the fields you want to use in your report. Your chosen fields are displayed in the area above the field list.
You can move fields around by clicking and dragging the fields.
-
If you want to group the data by a specific field, drag the field to the Group bar under the report Title field.
Grouping is optional in a report—you can group by a single field or by several.
-
In the toolbar, click Save

Save your report regularly if you expect to use it as an ongoing report. If it is an ad hoc query, you can run it without saving.
Toolbar buttons/icons
When you create a report, you have access to a toolbar for testing your fields, summarising your data, exporting the results to Excel and more.

|
Icon/button |
Purpose |
|---|---|
|
|
Saves the new or edited report. |
|
|
Opens the Report Designer window. |
|
|
Runs the report. |
|
|
Specifies the template on which your report is to be based. You can select another template from the drop-down. |
|
|
Displays the report in a summarised format. Click Run Report to test the results. You can save the results if required. |
|
|
Exports the report in Microsoft Excel spreadsheet format. |


A report is always based on a template, so when you create or change a report you are doing so within a pre-defined template. A template contains a definition of headers, footers and margins into which you can add the data, generally it does not contain any fields or data. In AE, you can create your own templates.
Additional resources
Our consulting team can assist with the creation and customisation of reports. Contact our sales teams to arrange this.